Texas public finance
Five Texas cities’ reserves coexist with long-term deficits
Dallas ended FY2025 with $399.6 million of unassigned General Fund balance and a $4.854 billion deficit once long-term obligations count. Four other big Texas cities show the same split.

At the end of FY2025, Dallas reported $399.6 million of unassigned General Fund balance and a negative $4.854 billion governmental unrestricted net position. I’d judge room for a new commitment by the payment path between them: the city’s basic statements show current resources in the first measure and include long-term obligations and deferred items in the second. Dallas FY2025 basic statements, PDF pages 59 and 62.
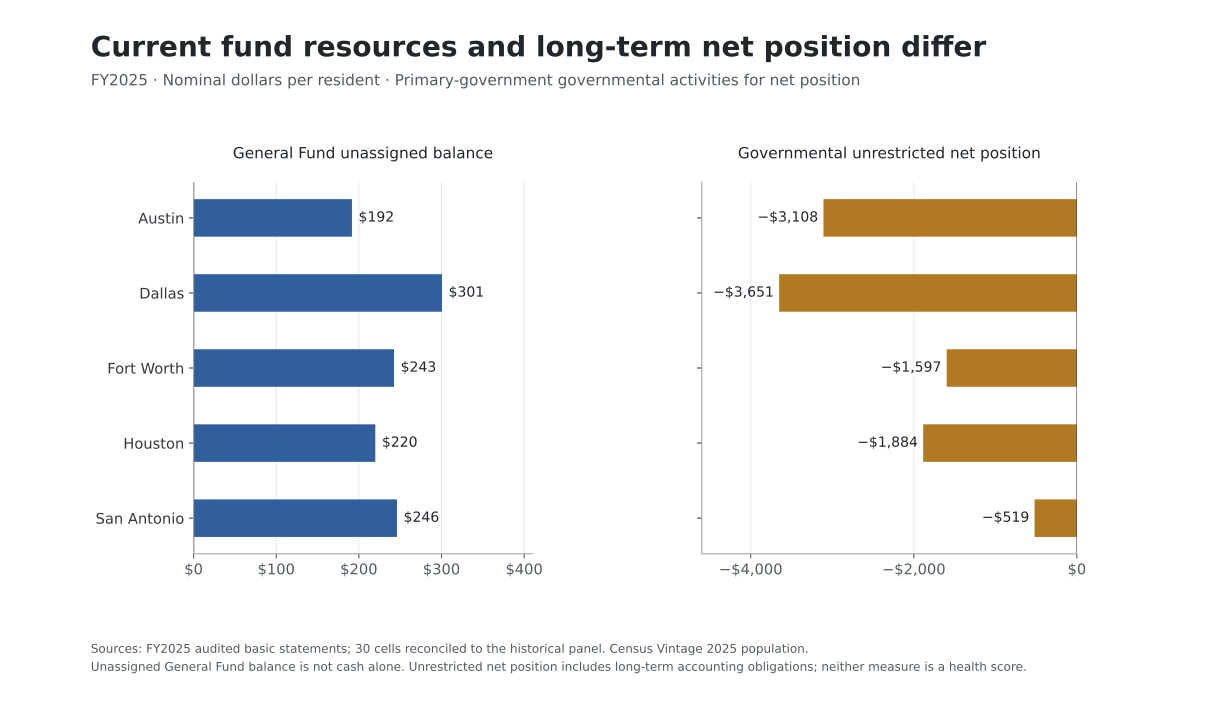
The pattern extends across Austin, Fort Worth, Houston, and San Antonio: positive General Fund balances beside negative governmental unrestricted net position. Employees earn benefits now, cities finance them later, and streets and bonds have their own calendars. A permanent new service competes with those future payments as well as this year’s reserve.
Method & limits
Reporting window: FY2015–2025; latest common audited year FY2025. Houston ends June 30; the others September 30. The original October 21 review reconciles thirty FY2025 cells; statistical histories and pension supplementary schedules are unaudited. Selected Dallas pension notes and schedules and GASB guidance were checked October 25, 2026. It does not refresh all five audits, contribution forecasts or legal transfer authority. The underlying record compares 459 overlapping metric-years and retains 24 published differences, alongside 30 current basic-statement tie-outs.
Current resources and long-term promises use different accounts
The General Fund uses modified accrual for current financial resources. Government-wide statements use full accrual, including obligations that require payment in later years. The Austin policies and Dallas statements explain why adding the two columns would produce no coherent budget measure.
A city can remain liquid while current revenue falls short of the full cost of services. Deferring contributions preserves operating resources today and leaves more funding work later. Long-lived obligations can be financed over time, but the contribution path has to fit recurring revenue.
Austin illustrates the scale of the problem: its $3.116 billion governmental unrestricted deficit accompanies about $2.2 billion of net pension liability and $771.7 million of OPEB liability. Those amounts are not all due next year. They still belong in a decision about a service that will continue next year and thereafter. The relevant bridge is the schedule of contributions and benefits, the recurring revenue available for it, and the other commitments already made against that revenue. Austin FY2025 report.
| City | General Fund unassigned balance | Governmental unrestricted net position |
|---|---|---|
| Austin | $192.1 | −$3,116.1 |
| Dallas | $399.6 | −$4,854.2 |
| Fort Worth | $249.4 | −$1,641.8 |
| Houston | $527.1 | −$4,517.6 |
| San Antonio | $381.1 | −$803.0 |
Nominal FY2025 stocks, rounded to $0.1 million. Different accounting bases: do not add or net these columns. The download includes the exact amounts and physical PDF page of each basic-statement cell in audit_tieouts.csv.
The tax revenue Austin ISD keeps and its usable budget show why headline collections and resources available for current operations need different measures.
Population rescales the same accounting
Dallas reports about $301 per resident in unassigned General Fund balance and −$3,651 per resident in governmental unrestricted net position. Austin’s figures are about $192 and −$3,108. The statement values use July 1, 2025 Census estimates to scale the cities, and the chart’s panels use different axes.
Per-resident values put differently sized cities on a common scale. They are not individual tax bills. Visitors, commuters and businesses also contribute revenue and use services; a municipal utility can serve customers beyond the city limits. Census July 1, 2025 resident estimates provide the denominator, rather than a modeled service population.
The utility can sit in a different place in the accounts
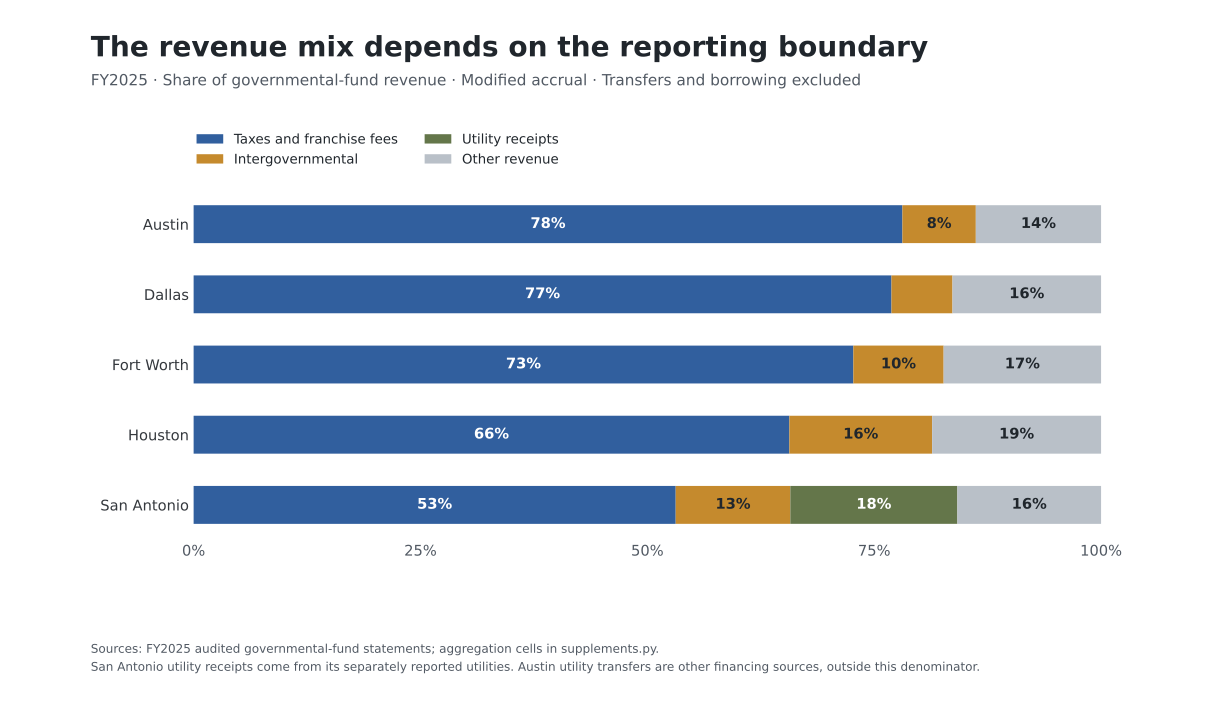
San Antonio reported $527.7 million of utility receipts in governmental funds in FY2025, 18.4% of their revenue. CPS Energy and SAWS are discretely presented component units. Austin’s electric and water utilities are within primary-government business activities; transfers into governmental funds appear as other financing sources rather than in the governmental-revenue denominator used here. San Antonio; Austin.
Tax and franchise revenue is about 53% of San Antonio’s governmental-fund revenue and 78% of Austin’s. San Antonio includes utility receipts in that denominator, while Austin records utility transfers as other financing sources outside it. I’d put those flows on the same basis before calling Austin more tax-dependent. A percentage cannot repair an inconsistent perimeter.
The utility’s sustainable contribution depends on customers, asset maintenance, and covenants. Business-type unrestricted net position is $1.124 billion in Austin, $617.9 million in Fort Worth, and $816.6 million in Houston. Dallas and San Antonio report negative amounts. These balances provide context for a transfer decision, leaving legal authority and future utility needs to be evaluated.
Dallas’s contribution gaps totaled $89.7 million
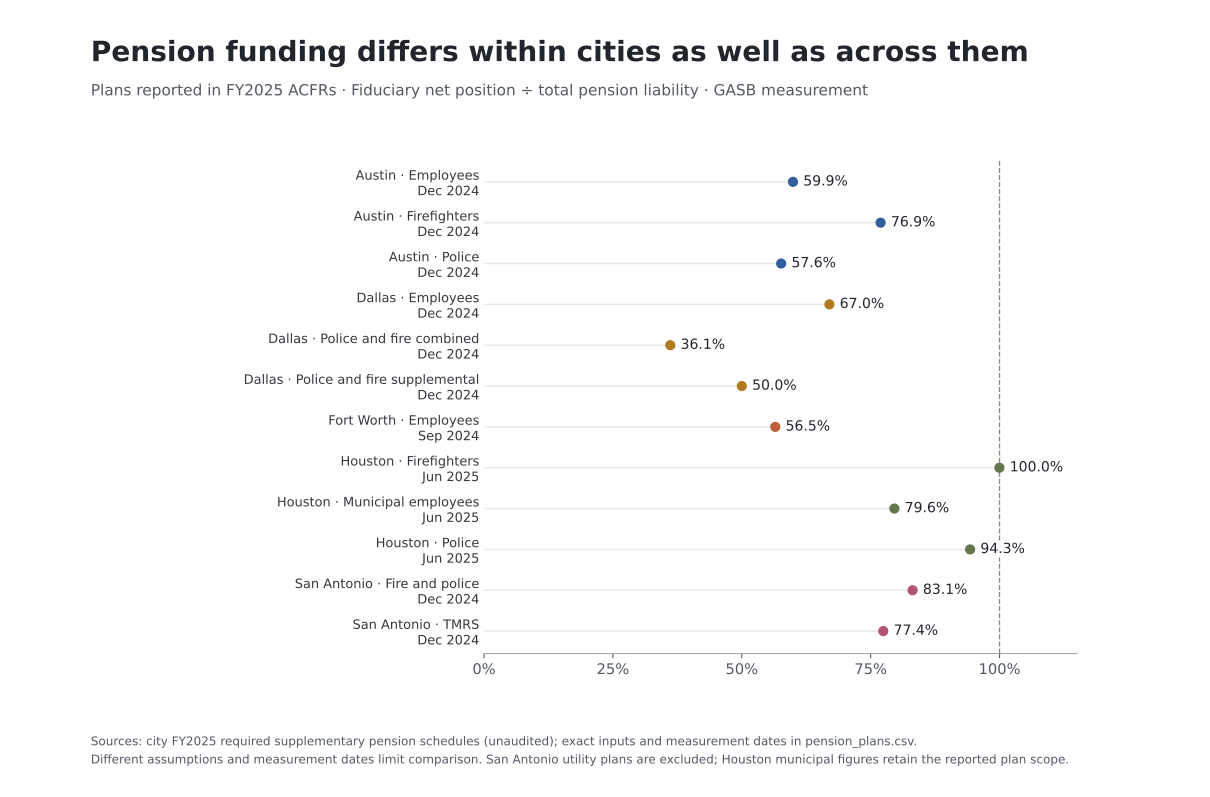
Dallas ERF’s net pension liability fell from about $3.0 billion at December 2023 measurement to $1.9 billion at December 2024. Yet FY2025 contributions were $83.4 million against a $130.6 million actuarial benchmark. Police and fire contributed $205.6 million against $248.1 million. The two gaps total $89.7 million; they compare funding with the actuarial benchmark, without finding a statutory breach.
The reporting framework explains why both statements can be true. GASB’s 2017 guidance distinguishes the assumptions used for financial reporting from those used to set a funding policy. It also says that contribution history matters when projecting future contributions. Accounting and funding are different exercises, but the future cannot be financed merely by writing a more ambitious policy. GASB questions 4.22–4.23.
Dallas ERF’s liability rises from $1.857 billion to $2.506 billion when the discount rate falls one percentage point, while the same report describes an October 2025 contribution phase-in followed by a 30-year amortization policy, showing how improved reported pension stock can coexist with a larger future budget claim. The extra $649 million is a sensitivity, not an immediate bill.
There is a legitimate countercase to treating every unfunded amount as a reason to hoard cash. A durable employer can finance long-lived obligations over time, and a reserve also has a public purpose when it absorbs a temporary shock. The decision turns on whether the contribution path is credible under weaker revenue and returns. Across these plans, different measurement dates, assumptions and employer populations prevent a clean ranking by funding ratio. Houston’s municipal plan also requires an employer-allocation bridge before its full reported liability can be assigned to the primary city. Houston.
| Plan | Actuarial amount | Actual | Difference |
|---|---|---|---|
| Employees (ERF) | $130.555 | $83.380 | $47.175 |
| Police and fire | $248.142 | $205.616 | $42.526 |
| Supplemental | $3.354 | $3.354 | $0.000 |
Difference = actuarially determined contribution minus actual contribution. Source: unaudited required supplementary contribution schedule, physical PDF page 176. The two main plans account for the $89.701 million total.
A revenue decline also needs a decomposition
Governmental-fund revenue fell 1.4% in Austin, 4.5% in Dallas, 2.6% in Houston, and 2.8% in San Antonio from FY2024 to FY2025. Fort Worth rose 2.5%. In every declining city, intergovernmental revenue fell by more than the total, with other categories offsetting some of the loss.
Dallas’s total revenue fell $128.6 million while intergovernmental revenue fell $168.1 million; the remaining lines collectively offset $39.6 million. Austin, Houston and San Antonio show the same direction of offset. A grant expiry can create an acute service problem without implying that the local tax base is shrinking. Conversely, replacing an expiring grant with a permanent local promise can turn a temporary receipt into a continuing burden. The next step is a grant-by-grant bridge to the activities it financed and the revenue proposed to replace it. The aggregate table cannot supply that bridge.
Fort Worth’s total increased by $42.4 million, including $4.5 million more intergovernmental revenue. Its operating scope also changed: MedStar EMS operations transferred to the city on July 1, 2025 and had not previously been part of it. The table reports the published totals; it does not isolate the transfer’s revenue effect. Fort Worth Note A.15, physical PDF pages 87–88.
| City | Total change | Intergovernmental | All other revenue |
|---|---|---|---|
| Austin | −$30.8 | −$46.6 | +$15.8 |
| Dallas | −$128.6 | −$168.1 | +$39.6 |
| Fort Worth | +$42.4 | +$4.5 | +$37.9 |
| Houston | −$107.6 | −$229.2 | +$121.6 |
| San Antonio | −$81.2 | −$132.1 | +$50.9 |
Total change = intergovernmental change + all other revenue change. Nominal dollars; rounding can affect displayed sums. Borrowing and transfers classified as other financing sources are excluded. “All other” is the remainder across revenue categories, not a measure of recurring tax revenue.
A decade of growth includes changes in the city itself
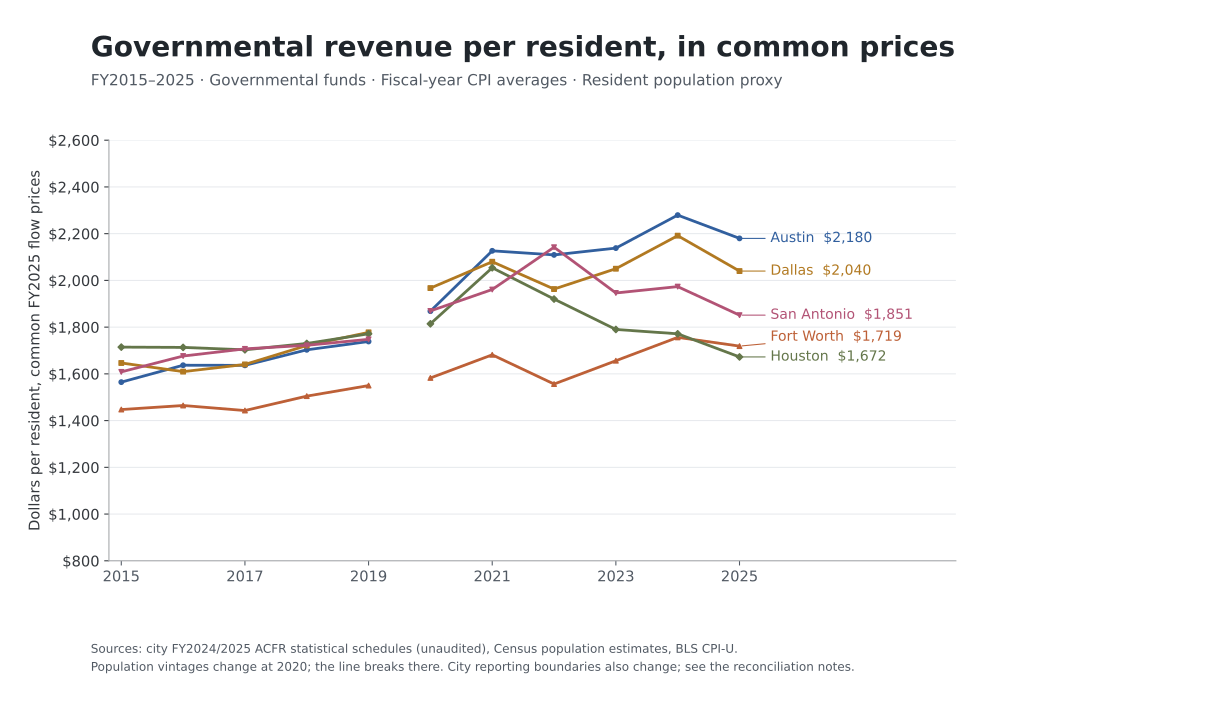
Real per-resident governmental revenue rose about 39% in Austin, 24% in Dallas, 19% in Fort Worth, and 15% in San Antonio over FY2015–2025, while Houston fell about 2%. The city histories, CPI, and Census denominators describe the changing reported footprint, including grants and transferred operations.
Some of that apparent growth follows changes in what the city reports. Dallas moved sanitation to enterprise funds in FY2016 and stormwater in FY2024. Its balance history restates FY2023 for stormwater; its flow history does not. Fort Worth’s EMS transfer changes its perimeter too. The population series crosses Census estimate vintages at 2020, which is why the chart breaks there. These are not fussy exceptions to an otherwise clean race. They determine which race the numbers could plausibly describe.
Debt comparisons need the same issuer and payment dates
The Texas Bond Review Board reports issuer principal at August 31. City financial statements use their own fiscal ends and carrying-value definitions, which can include premiums, discounts, leases and other obligations. Utility and component-unit boundaries add another difference. A larger issuer total therefore needs an issuer-to-financial-statement bridge before it can support a comparison of city budget burdens. Texas BRB city records.
For FY2025, the cities’ reported governmental debt-service ratios range from 11.1% to 17.9% of their noncapital expenditure denominators. A ratio can move because debt payments change or because the spending denominator changes. The report-specific capital definitions matter too. The download reports these ratios beside the BRB principal series, with their own definitions.
The historical source check found a more immediate problem: Fort Worth’s printed debt-service percentages for FY2016–2023 do not match a direct calculation using the principal, interest/issuance costs, expenditures and capital figures printed in those schedules. For FY2016, the calculation gives 11.57%, compared with 12.41% in the source. Those eight observations remain flagged and are excluded from historical debt-ratio conclusions. FY2015, FY2024 and FY2025 reconcile at the printed precision. Fort Worth report.
The next promise must fit the payment path
A permanent service makes a claim on several future budgets. Its funding competes with debt service, pension and retiree-health contributions, and the capital needs behind any utility transfer. The recurring revenue left after those commitments is the city’s room to make another promise. Temporary grants and a favorable return year can enlarge a reported balance without permanently enlarging that room.
Reserves matter because adjustment takes time. Taxes, staffing and capital programs cannot all change when a forecast changes. A cushion can spare a city from a damaging permanent cut in response to a temporary shock. If the gap endures, however, spending the cushion postpones the revenue or service decision until there is less time to make it.
I’d support a permanent expansion when recurring revenue can pay existing commitments and leave room for the new service. Dallas can have both current reserves and substantial claims on future revenue. The contribution and payment path decides how much room exists between them.
Sources
- Austin FY2025 Annual Comprehensive Financial ReportCity of AustinVerified Oct 21, 2026
Physical PDF pages 45 (net position), 48 (fund balances) and 50 (fund flows). Historical statistical schedules are unaudited. Electric/water operations are primary-government business activities.
- Dallas FY2025 Annual Comprehensive Financial ReportCity of DallasVerified Oct 21, 2026
Physical PDF pages 59, 62 and 64 (basic statements); 174–176 (unaudited pension RSI). Sanitation and stormwater changes remain explicit; FY2023 balance and flow histories have different restatement treatment.
- Fort Worth FY2025 Annual Comprehensive Financial ReportCity of Fort WorthVerified Oct 21, 2026
Physical PDF pages 47, 50 and 53 (basic statements); 87–88 (MedStar transfer, Note A.15). Eight historical debt-ratio discrepancies remain flagged. Accrual sales tax is grouped with other local taxes in the selected history.
- Houston FY2025 Annual Comprehensive Financial ReportCity of HoustonVerified Oct 21, 2026
Physical PDF pages 45, 48 and 51 (basic statements). Fiscal year ends June 30. Pension plan scope requires an employer-allocation bridge before aggregation as a primary-city obligation.
- San Antonio FY2025 Annual Comprehensive Financial ReportCity of San AntonioVerified Oct 21, 2026
Physical PDF pages 59, 61 and 63 (basic statements). CPS Energy and SAWS are discretely presented component units; utility pension plans are outside this primary-city plan set.
- Vintage 2025 incorporated-place population estimates, TexasU.S. Census BureauVerified Oct 21, 2026
Vintage 2025 Texas incorporated-place estimates for FY2020–2025, with Vintage 2019 for FY2015–2019. The chart breaks at 2020. July 1 residents are scale denominators, not service counts.
- CPI-U, all urban consumers, all items, U.S. city averageU.S. Bureau of Labor StatisticsVerified Oct 21, 2026
Unadjusted monthly CPI-U, 2014–2025. Flows use city fiscal-year averages; stocks use ending-month CPI. Exact factors and the frozen response are in the download.
- Texas Bond Review Board city issuer debt recordsTexas Bond Review BoardVerified Oct 21, 2026
Issuer principal at August 31, 2025, grouped by tax/revenue support. Not interchangeable with ACFR carrying value. No completed issuer-to-ACFR bridge or debt-stock ranking.
- GASB Implementation Guide 2017-1, questions 4.22–4.23Governmental Accounting Standards Board · 2017-04Verified Oct 25, 2026
The 2017 guidance distinguishes financial-reporting and funding assumptions, while making contribution history relevant to projected contributions. Explains the framework; no Texas plan was freshly audited.
Supporting material
- Download the research and reproducible calculations ↗CSV data, definitions, source hashes and page locators, five full-size figures, methods and Python scripts. Original city PDFs are linked by frozen URL and hash rather than duplicated.
- Read the methods and remaining limits ↗Fiscal calendars, inflation windows, population vintages, pension scope and source discrepancies.
- Inspect the FY2025 basic-statement tie-outs ↗Thirty reconciled values with exact physical PDF page locators.
- Inspect the revenue-change bridge ↗Exact total, intergovernmental and remaining revenue changes underlying the displayed table.