Texas public finance
Austin ISD keeps 49 cents of each maintenance-tax dollar
Of the $1.511 billion in maintenance-and-operations taxes Austin ISD booked in FY2025, recapture sent $771.6 million away. Enrollment fell 9.5% over six years, and revenue per student lost ground to inflation.

Austin ISD booked $1.511 billion of maintenance-and-operations taxes in FY2025 and kept $739.2 million after recapture. That is about 49 cents per dollar. I’d judge the budget from that remaining entitlement and its continuing costs, because the homeowner’s tax bill overstates the district’s operating resources. The FY2025 audit records $771.6 million going to recapture.
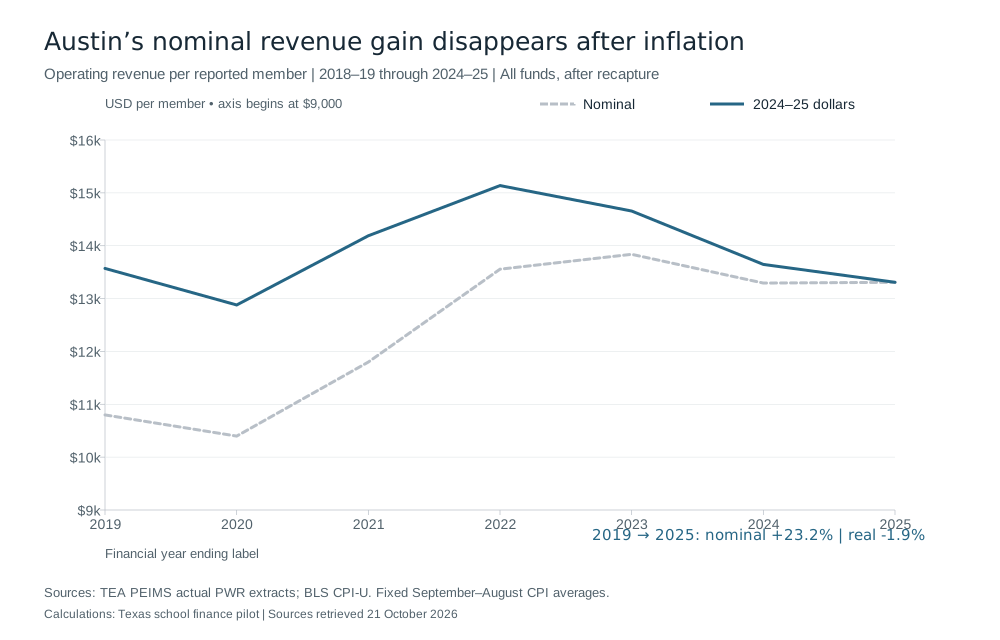
Funding composition also changes the story. Operating revenue per member rose 23.2% from the school years ending in 2019 to 2025, against 25.7% inflation: a 1.9% real decline. Excluding federal revenue turns that into a 1.4% real increase. Meanwhile membership fell 9.5%. The district has to replace expiring receipts or change the work they funded. TEA actuals and the CPI calculation show the comparison.
Method & limits
Financial actuals and the selected 12-district TEA panel remain through FY2025, with original October 21, 2026 data editions. The FY2025 Austin audit’s General Fund statement and accounting notes were checked October 25, 2026. SBITA recognition is distinguished from a cash receipt. Added TEA material explains the February 2025 recapture framework and the December 2020 settle-up process; no historical estimate or rate is presented as a new universal 2026 rule. Per-member comparisons use published membership, not average daily attendance. CPI is a broad benchmark, and reporting calendars, classifications, grant composition and remaining source-cell differences are retained. No service-efficiency or school-outcome finding is inferred.
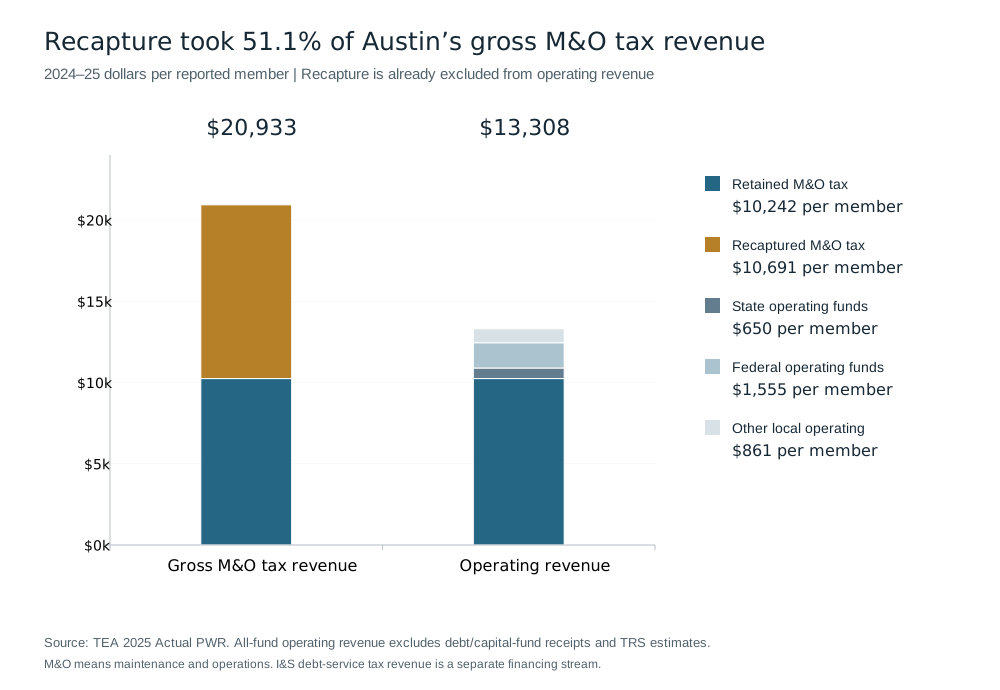
Recapture took 51.1% of M&O tax revenue
$771.6 million ÷ $1.511 billion = 51.1%. This applies to booked maintenance-and-operations tax revenue. Debt-service taxes finance a different purpose and sit outside that denominator. Audited tax schedules.
TEA’s reported operating revenue already excludes recapture. Subtracting $771.6 million from that operating figure again would manufacture a second loss. For FY2025, M&O taxes after recapture contributed about $10,242 per member; state operating revenue about $650; federal revenue $1,555; and other local revenue $861. Together they produced $13,308 in reported operating revenue per member. The $10,691 of recapture per member sits outside that operating total. TEA source cells and definitions.
Austin’s Comptroller T2 taxable value rose from $134.0 billion in tax year 2019 to $187.4 billion in 2024, about 39.9%. Those years map to school years ending in 2020 and 2025, so their endpoints differ from the operating-revenue comparison. Exemption and valuation rules also affect T2. Property-value reports describe that base. TEA’s February 2025 explanation ties excess local revenue to entitlement: more property value doesn’t let the district keep a fixed share of each extra tax dollar.
More dollars bought slightly less per member
Austin’s published membership fell from 79,787 to 72,175 over the selected endpoints. Nominal operating revenue per member rose from $10,799 to $13,308. At FY2025 prices, the earlier figure is $13,570, leaving the later year about $262 lower per member. The denominator matters: a per-member increase can coexist with fewer pupils and a different total budget. TEA actuals.
The price adjustment uses national CPI-U, all items, averaged over September through August. CPI measures general purchasing power; school wages, special-education costs, and construction can follow different prices. Austin’s latest audited fiscal year ends June 30. Repeating the comparison with July–June CPI changes the real decline from 1.9% to 1.8%, preserving its direction. Inflation calculation; fiscal-year definition.
Fewer members don’t remove buildings, bus routes, and staffing in the same proportion. A 1.9% decline in revenue purchasing power says little about which costs can disappear. I’d put the service and building plan beside those funding figures before judging the budget. The state formula also uses attendance and weighted need, while this comparison uses published membership.
The federal-funding sensitivity changes the result
Federal revenue changes the sign of the comparison. With all federal revenue, real operating revenue per member fell 1.9%; without it at both endpoints, it rose 1.4%. That rules out a story of uniformly shrinking state-and-local purchasing power, while making the end of temporary funding more consequential.
The audit records ESSER III federal receipts of $47.8 million in FY2024 and $6.4 million in FY2025, down 86.5%. Total federal operating revenue fell from $222.9 million in FY2023 to $112.2 million in FY2025 in the TEA series. A grant-level crosswalk is needed before assigning the whole federal decline to ESSER or removing continuing programs with temporary ones.
A temporary grant can pay for a valuable service and still leave a difficult decision when it ends. Keeping the service requires a replacement source; ending it changes what pupils receive. The budget risk lies in allowing the continuing cost to outlive its named funding. A grant-by-grant schedule, joined to the commitments each grant created, would show which part of the reported revenue belongs in the next year’s plan.
Financing narrowed the fund-balance draw to $28.9 million
The General Fund’s $1.656 billion of revenue fell $90.9 million short of $1.747 billion of expenditure. Other financing sources of $62.0 million narrowed the fund-balance decline to $28.9 million. The C-3 statement reconciles accounting entries, including financing that didn’t arrive as spendable cash.
Maintenance notes account for $45.2 million of other financing, software subscriptions for $15.9 million, and asset sales for $0.9 million, but the audit’s SBITA policy records both a right-to-use acquisition and a financing source, so the $15.9 million entry can narrow the fund-statement gap without depositing spendable cash for other services. The acquisition has a future payment schedule.
Borrowing and subscriptions create future payment claims while spreading asset costs over their use. I’d carry those payments into the next operating plan. Neither the $90.9 million expenditure gap nor the $28.9 million fund-balance draw substitutes for a recurring cash schedule.
The TEA-to-audit revenue bridge, after adding recapture and estimated state TRS payments, differs by $3,146. The expenditure bridge differs by $237, and recapture ties exactly. Those small unresolved differences stay visible rather than being forced into agreement.
| Statement item | Nominal dollars |
|---|---|
| Revenue | $1,656,021,776 |
| Expenditure | $1,746,900,764 |
| Deficiency before other financing | −$90,878,988 |
| Other financing sources, net | $62,017,451 |
| Change in fund balance | −$28,861,537 |
June 30, 2025 fiscal year end. Audited basic statement C-3. A fund-balance change is not the same measure as the TEA operating-revenue-minus-operating-expenditure calculation.
The city-finance comparison shows what a fund balance can and cannot show when annual spending and long-term obligations sit in different accounts.
Nine of twelve districts lost real revenue per member
Nine of the 12 selected districts had lower real operating revenue per member in 2025 than in 2019. The panel spans large traditional urban and suburban districts around Austin, Houston, Dallas–Fort Worth, and San Antonio. It illustrates variation, with different grant mixes and calendars, rather than representing all Texas districts.
Austin’s real operating expenditure per member rose 7.8% in the published series over the same labels. That divergence deserves investigation, but subtracting these two reporting series does not reproduce a GAAP deficit. State pension payments, classifications and the operating-function definition have to be reconciled. The audited General Fund bridge above is the stronger evidence for the fund’s actual annual result.
Bond finance makes another claim on taxes. BRB’s Austin tax-supported principal rose from $1.122 billion at August 31, 2019 to $2.595 billion at August 31, 2025. It is a debt stock at a state reporting date, not a measure of classroom funding or the same carrying-value balance reported in the June 30 audit. A bond authorization and an operating appropriation need their own decisions. BRB district data.
The budget has to survive its next funding year
Reserves and asset financing have legitimate jobs. They can absorb a transition or align an eligible asset’s payments with its use. A continuing service needs a continuing funding source once that transition ends. A manageable draw in the current statement is valuable breathing room, but the budget earns durability through the revenue and service decisions made while it lasts.
Austin’s FY2025 booked recapture of $771.6 million exceeds TEA’s near-final $770.9 million figure by $720,744. The recapture history and settle-up explanation show why estimates, revised inputs, and final audited tax collections need reconciliation. They don’t identify the individual revision behind this precise difference.
I’d use the breathing room to align recurring services with recurring resources. Austin’s property wealth helps divide the Texas school-funding bill; it doesn’t decide how cheaply Austin can run its schools. After recapture and expiring grants, the district still has to fund particular buildings, people, and services. A smaller draw on reserves buys time to make that choice.
Sources
- TEA PEIMS financial actual reports, school years ending 2019–2025Texas Education AgencyVerified Oct 21, 2026
Seven frozen statewide actual-report workbooks. The download contains selected district cells with sheet, row and column provenance. Operating revenue excludes recapture; membership is not ADA.
- Austin ISD FY2025 Annual Comprehensive Financial ReportAustin Independent School DistrictVerified Oct 21, 2026
Fiscal year ended June 30, 2025. C-3 supplies audited General Fund results. The ESSER III combining schedule is physical PDF page 120; statistical schedules elsewhere in the report are unaudited.
- Austin ISD FY2024 Annual Comprehensive Financial ReportAustin Independent School DistrictVerified Oct 21, 2026
ESSER III combining schedule, physical PDF page 125; fiscal year ended June 30, 2024.
- CPI-U, all items, U.S. city average, not seasonally adjustedU.S. Bureau of Labor StatisticsVerified Oct 21, 2026
Series CUUR0000SA0. September–August annual averages; July–June sensitivity for Austin. This is not a school-specific cost index.
- School district property values and tax ratesTexas Education Agency / Texas ComptrollerVerified Oct 21, 2026
Comptroller final T2 values republished by TEA. Austin, Eanes, and Round Rock worksheets were reconciled; tax-year-to-school-year mapping is explicit.
- Texas Bond Review Board school district dataTexas Bond Review BoardVerified Oct 21, 2026
Austin issuer 140. Tax-supported principal at August 31; source ADA differs from TEA membership.
- Excess local revenue and district recapture historyTexas Education AgencyVerified Oct 21, 2026
Near-final settlement differs from district-booked expense. The history workbook is dated November 2025 in its filename.
- TEA: Excess Local Revenue (Recapture), February 2025Texas Education Agency, Office of School Finance · 2025-02Verified Oct 25, 2026
Explains entitlement-based excess local revenue and the variables used in final determination. Its rates and statewide table are dated February 2025; this essay uses the mechanism, not a claim that every listed rate remains current.
- TEA: Settle-Up ProcessTexas Education Agency, Office of School Finance · 2020-12Verified Oct 25, 2026
Distinguishes estimated allocations, near-final revised inputs and final audited tax collections. Does not explain the precise Austin booked-versus-near-final reconciliation difference.
Supporting material
- Data, definitions and source register ↗CSV data, methods and dated source links. Original public reports remain with their publishers; the source register records their frozen research hashes.